April 2026 Product Update: Options Income Tracker
The gap: premium is easy to earn, hard to track
Options income trading looks straightforward on paper. Sell a put, collect premium, repeat.
In practice, the work is bookkeeping. After a few weeks, you are managing dozens of legs across symbols and expirations. Rolls, partial closes, assignments, and expirations turn a simple strategy into a pile of transactions.
Most tools either show you the chain or show you your broker history. Very few give you a strategy-level view of what you earned, what is still open, and what needs attention.
What we shipped
This release introduces the Options Income Tracker. It is a premium-first workspace built for covered calls and cash-secured puts.
It includes a trades table, premium charts, a P&L calendar, an Active Positions panel, and an alerts layer that highlights common “needs attention” situations.
If you run the wheel, you can also group legs into Wheel Cycles so rolls and assignments stop breaking your history.
Why this matters for options income traders
With premium-selling strategies, edge is mostly process. Small decisions repeated monthly compound. Small mistakes repeated monthly do too.
A clean ledger gives you two things. First, a feedback loop. You can review what you did and measure whether the process is improving.
Second, a control panel. You can see what is open, what is near expiration, and where assignment risk is rising before it becomes a surprise.
Options Income Tracker: one clean table
The Tracker is built around a single view of your trades. Every row is a leg with the fields you actually use: opened date, expiration, strike, contracts, premium, and status.
Filters let you slice by month, symbol, exercised, and rolled. Export CSV when you want a local copy or a second set of books.
From the same screen you can add a trade manually or import a batch.
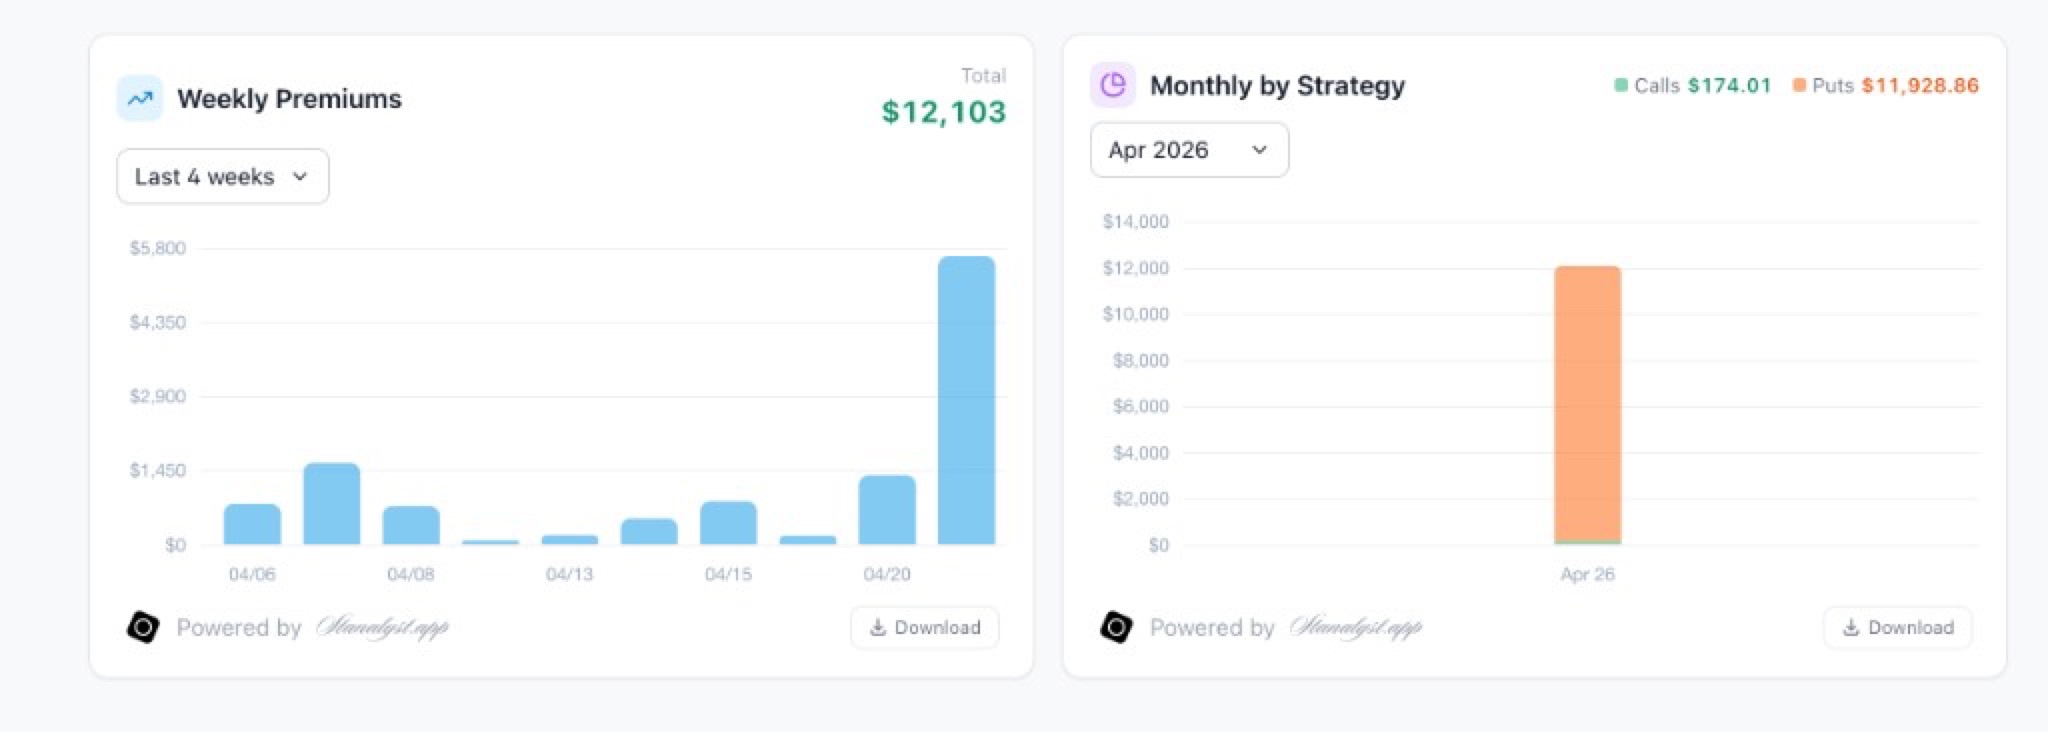
Premium charts: weekly and strategy breakdown
Premium is only useful if you can see it in context.
Weekly Premiums shows a quick read of how often you are deploying risk. Monthly by Strategy breaks premium into calls versus puts so you can sanity-check what is driving the P&L.
These charts are meant to answer one question fast: is your process doing what you think it is doing?
P&L calendar and day insights
Premium is time series data. The P&L calendar turns your trade log into a quick visual read. You can see which days you deployed risk and how much premium you collected.
Click a day to preview the trades and total premium. If you want context, open Day Insights to generate an AI summary for that date.
Day Insights is designed for review. It helps you answer: what you did, what risk you took, and what is worth checking next. You can copy the output, or re-run the analysis after you edit trades.
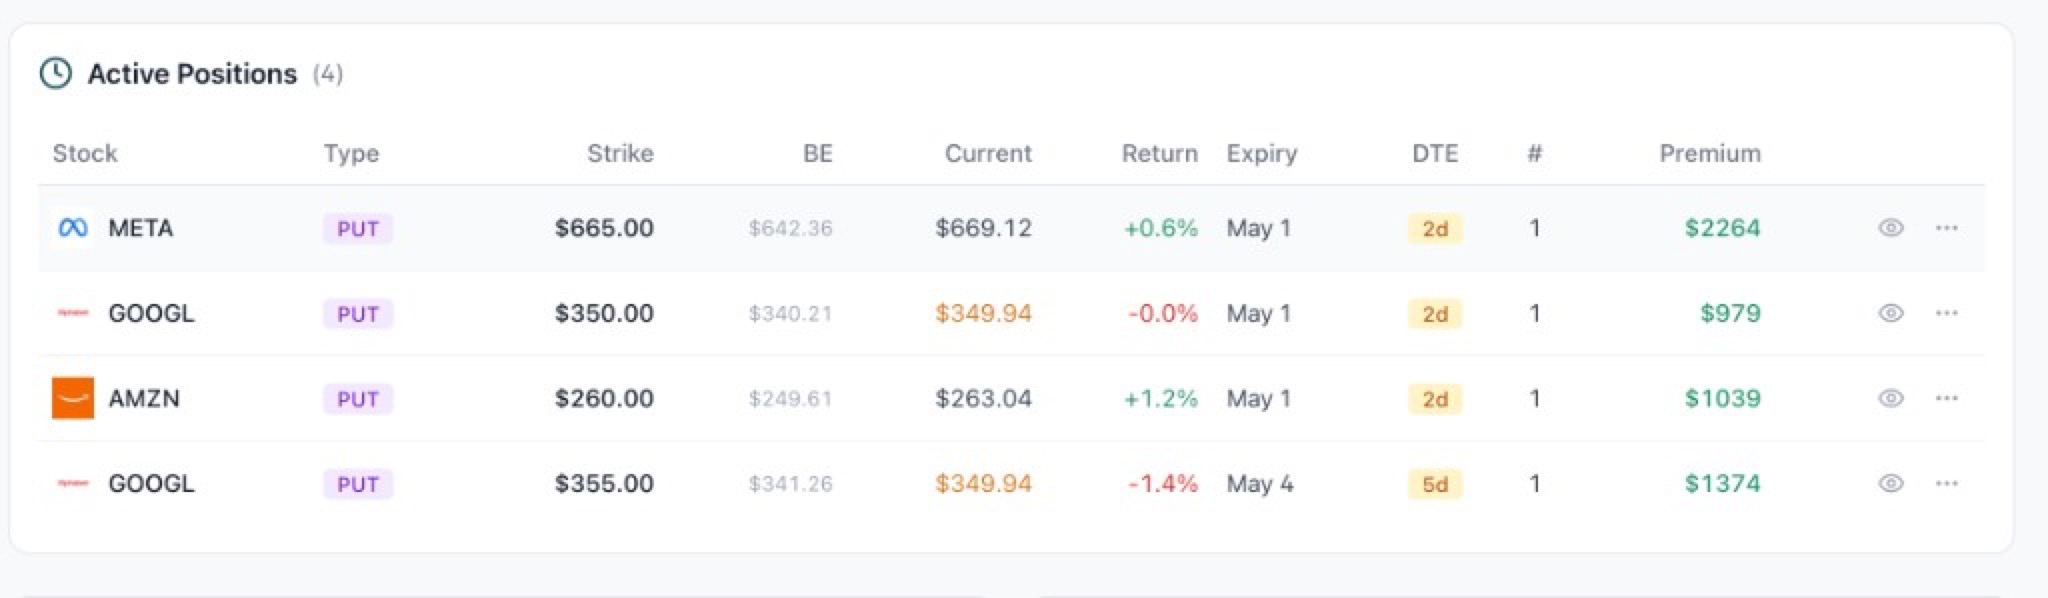
Alerts and Active Positions
The highest-impact mistakes happen when a position needs action and you miss it.
Alerts flag a few common situations: expiring soon, near strike for calls, and near breakeven. Alerts are informational, not financial advice. They are meant to surface what deserves a review.
Active Positions shows what is currently open, sorted by days to expiration. You get breakeven, current price, premium, and quick actions to mark closed, rolled, assigned, exercised, or expired.
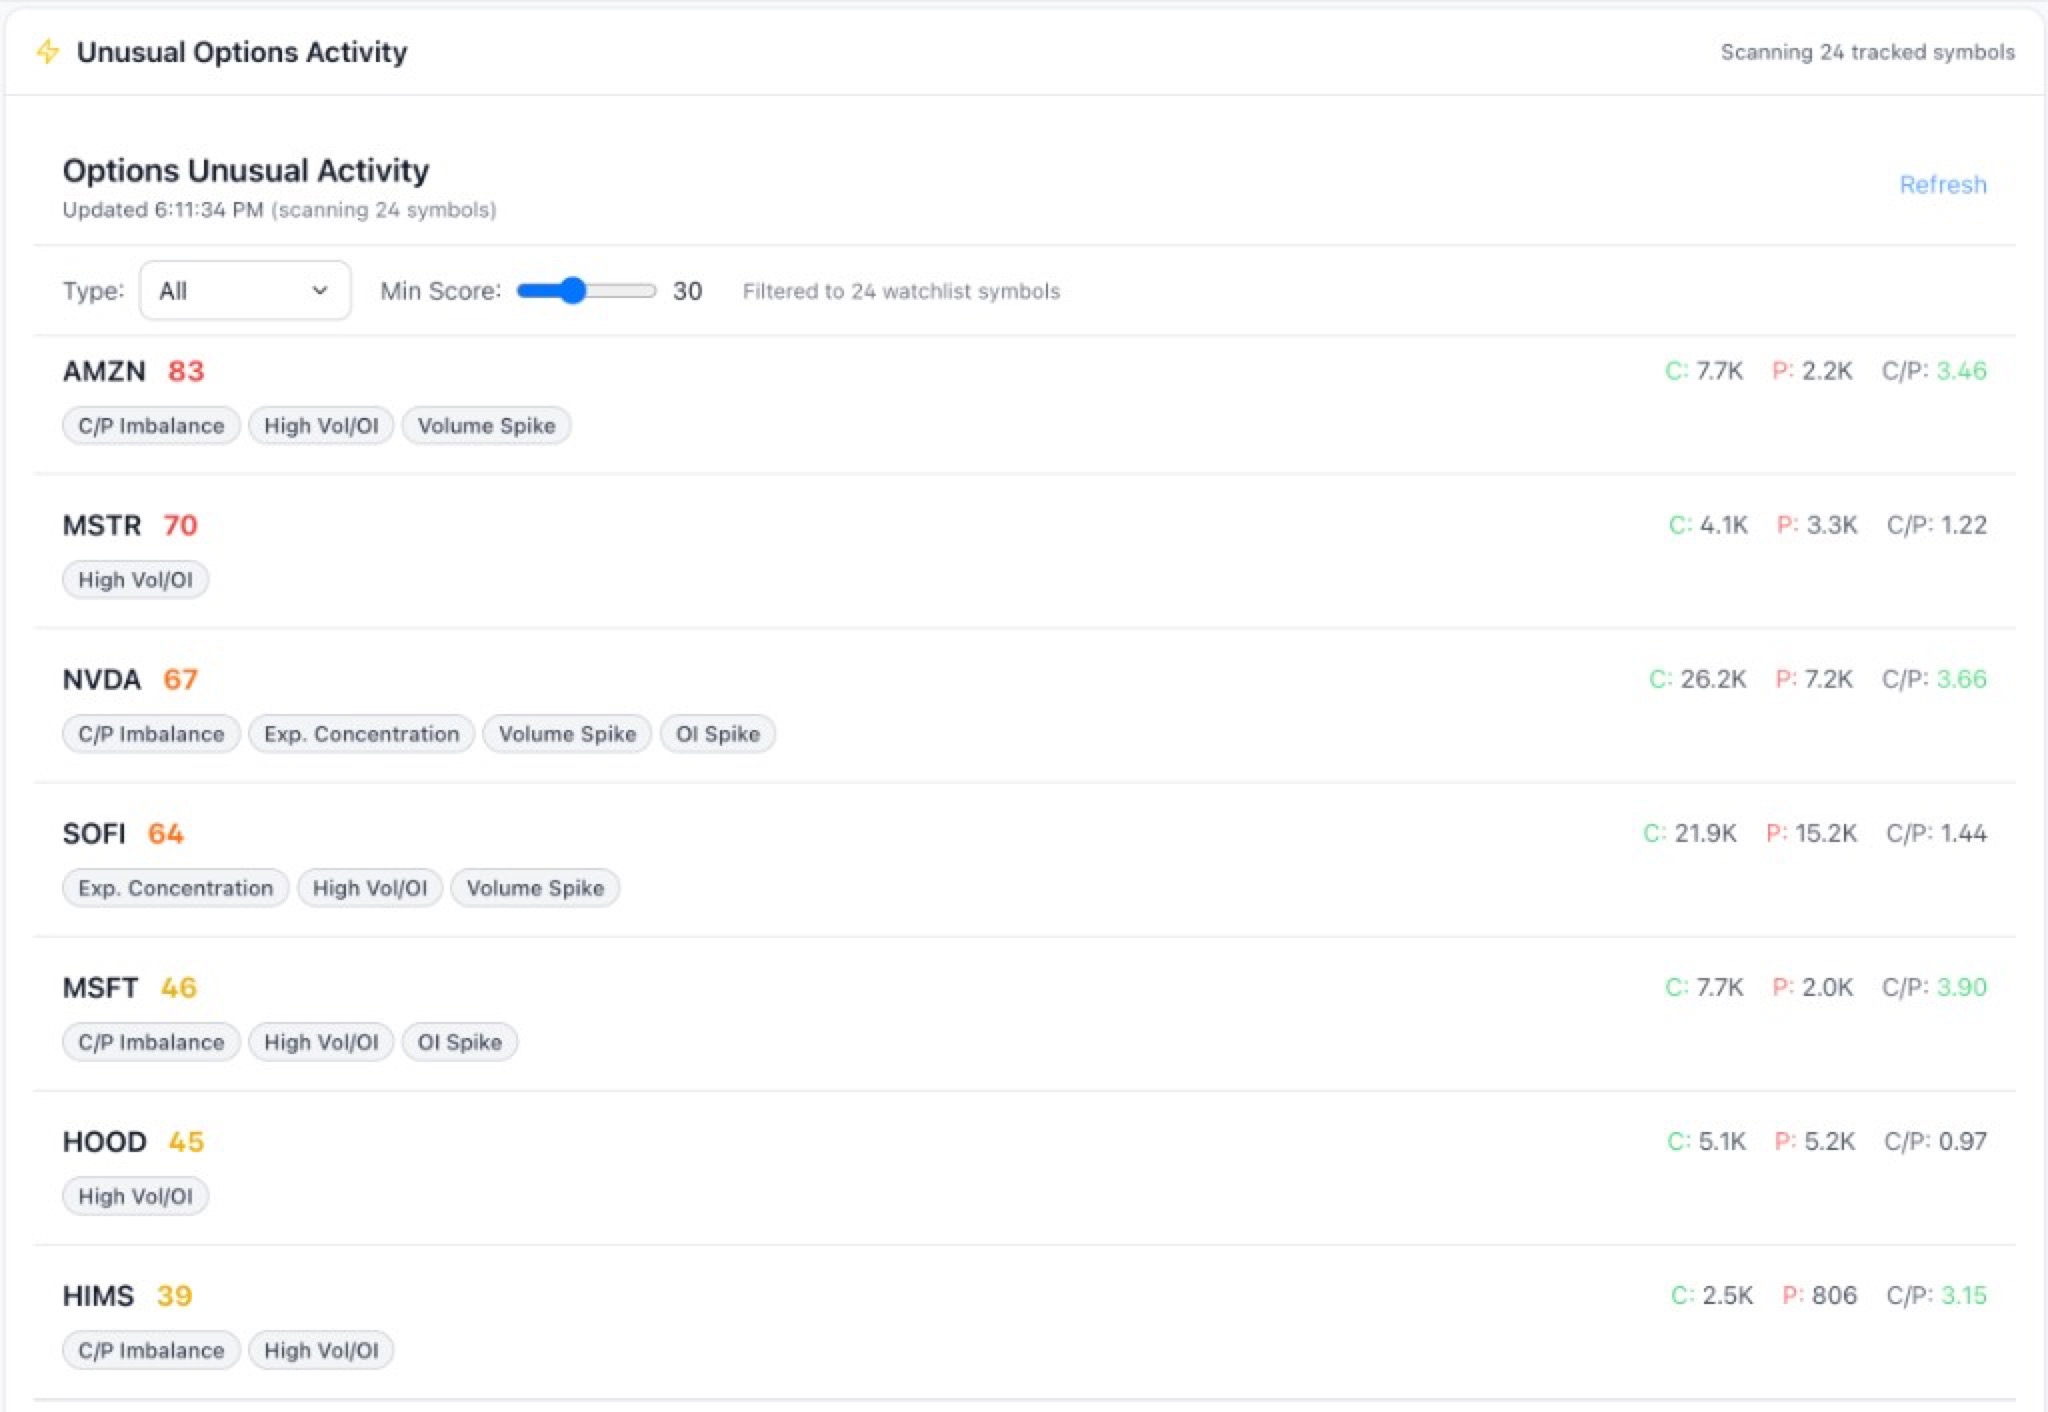
Unusual options activity, scoped to your book
When you are managing positions, context matters. If a ticker starts moving, you want to know whether the options market is waking up too.
The tracker includes an Unusual Options Activity scanner that filters to the symbols you are already tracking. It is a context tool, not a trade signal. Use it to triage what deserves deeper research.
Wheel cycles: keep rolls and assignments readable
Rolls are where most tracking systems fall apart. A Wheel Cycle is a simple grouping concept: all legs tied to the same underlying over time.
Create a cycle, attach legs, and you get one net premium number across the sequence. You can add notes, export cycles, and keep an audit trail that stays coherent even when the trade management gets messy.
Importing trades without rebuilding a spreadsheet
You can paste CSV or TSV straight from Google Sheets or Excel. Imports are deduped so you can paste safely without creating duplicates.
If you are on Analyst+, screenshot import can extract sold-to-open option trades from a cropped brokerage screenshot. Crop out account numbers. Zoom to 150% to 200% and capture only the transactions table for best results.
The goal is speed. You should be able to rebuild your book in minutes, not hours.
What is next
We are continuing to tighten the loop between research, execution, and review.
Next up is making the tracker even less manual. That means smarter defaults, fewer status updates, and richer context inside Day Insights so your review takes minutes instead of a weekend.
Track premium without spreadsheets
Import your trades, see what is open, and keep roll history and wheel cycles organized. When you want context, generate day-level insights in one click.
Try Stanalyst freeWeekly market note, delivered free.